A drive to the basket reads the help defence the replay shows
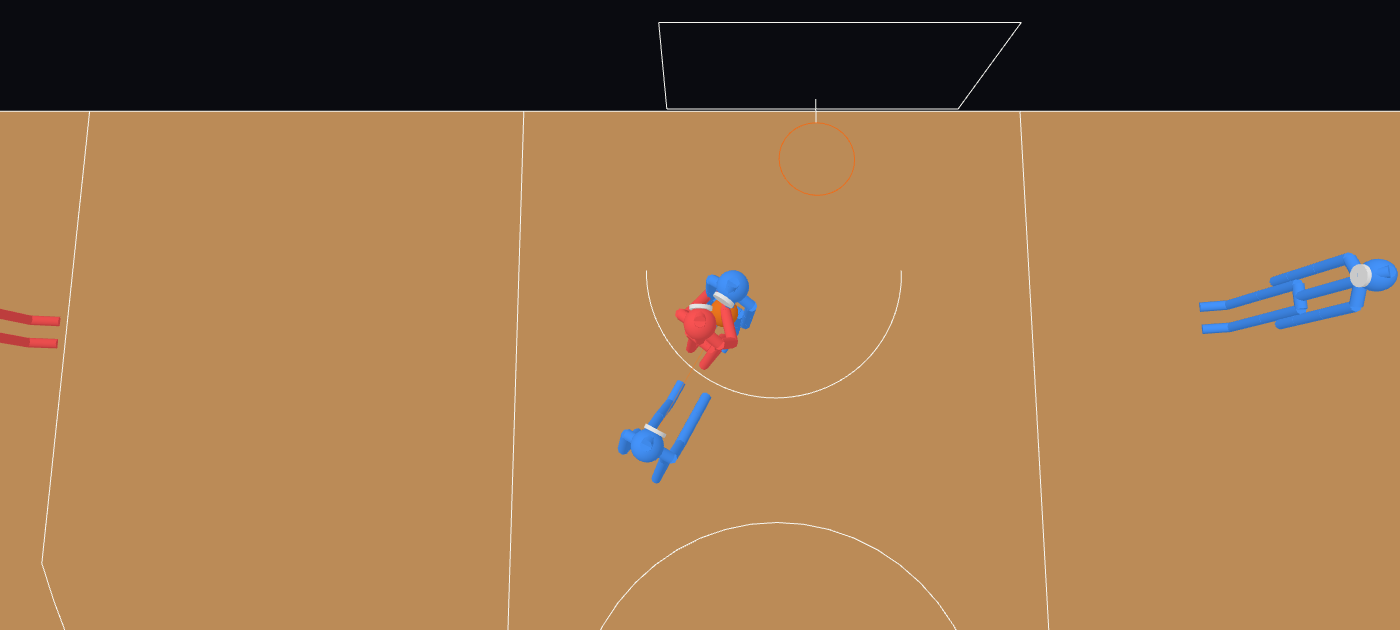
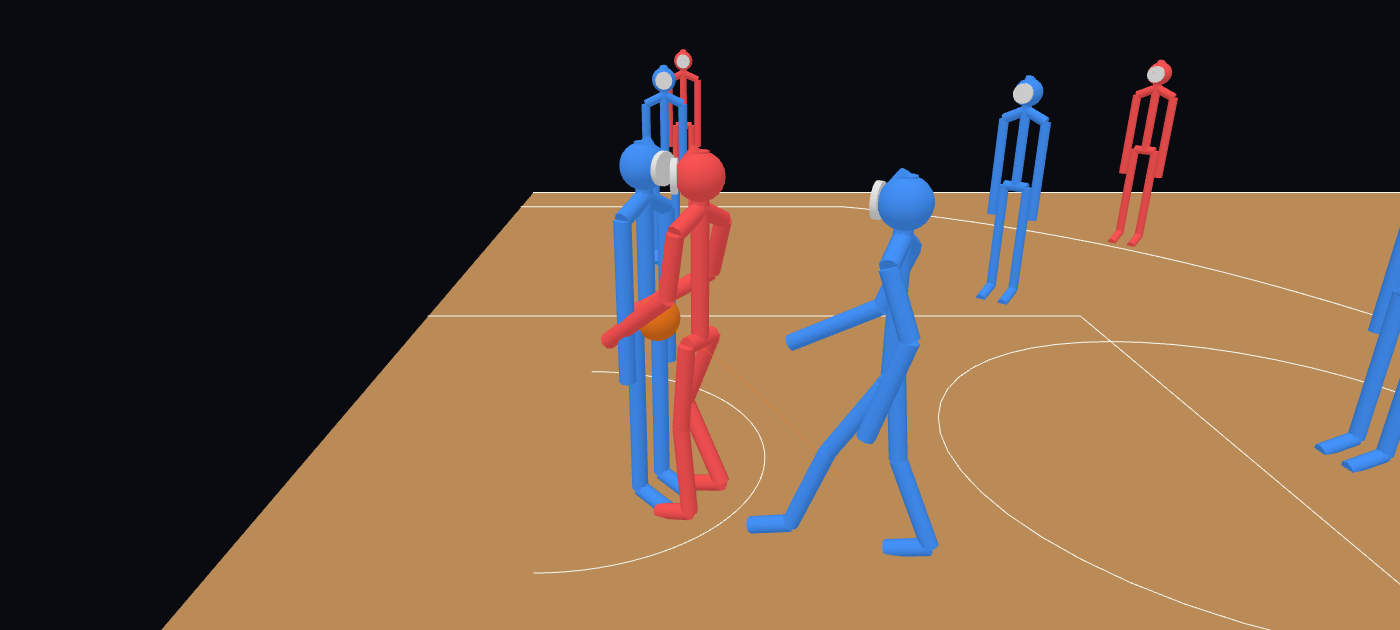
When a ball handler gets past their defender, the simulation has to decide what the drive is worth: go all the way to the basket, or pull up and pass out. That depends on the help defence, the teammates who leave their own men to stop the ball. Until now the price of finishing a drive imagined every helper running straight at the driver and stopping at arm's length. The replay drew something else: one helper stepping in between the driver and the basket, or setting up to take a charge, and the rest going to their own places around their men.
Measured before anything changed
The two were first compared over 395 beaten drives, before a line of the simulation changed. The price was optimistic every single time. It put the closest defender 0.90 m from the finisher, but the replay had them 0.29 m away, a body's width. The price counted about four defenders contesting the shot, and the replay had two. So the price gave the finish a 68% chance to go in, where the defence the replay drew allowed 51%.
One defence for the price and the picture
Now the finish is priced on the same runs the replay draws for every defender after the drive gets by. The helper goes where the replay puts them, the beaten defender chases on the driver's hip, and the others move around their men and around the driver. A driver deciding whether to go all the way now sees the help that is actually coming.
What changed on the court
Nothing was tuned toward these numbers. They are what came out once the drive was priced on the defence the replay shows. Across the same 20 games, per 100 possessions, before and after:
| Before | After | |
|---|---|---|
| Drives chosen | 196 | 158 |
| Drives that got by their defender | 30.1 | 20.2 |
| Charges taken | 0.24 | 0.03 |
| Threes, as a share of shots | 64.4% | 73.0% |
| Shots at the rim, as a share of shots | 20.8% | 14.1% |
| Shots at the rim made | 55.0% | 59.1% |
| Points | 110.8 | 111.6 |
A finish at the rim is worth less than the old estimate said, so players drive less and shoot more from beyond the arc. Of the shots still taken at the rim, more go in.